Bobinas P4G
  • Login
  • Public

    • Public
    • Groups
    • Popular
    • People

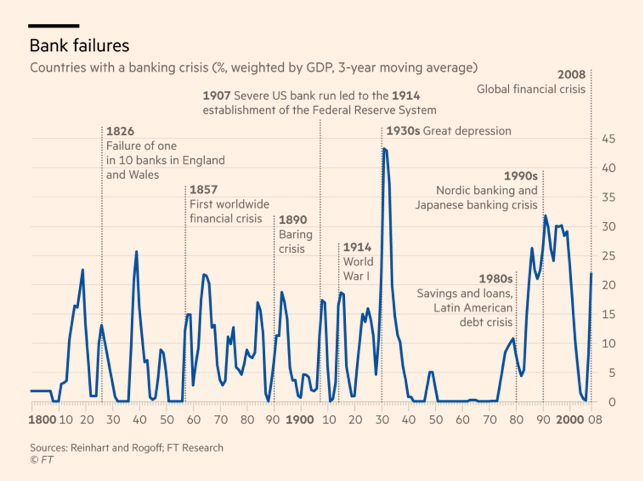
Chart: Bank Failures [from 1800]; Countries with a banking crisis (% weighted by GDP, 3-year moving average_ Chart shows from 1800 regular spikes of banking crisis except for the two decades starting in 1950

Download link

https://cdn.masto.host/zirkus/media_attachments/files/110/094/080/272/905/576/original/c7031d1096808a7e.png

Notices where this attachment appears

  1. Emeritus Prof Christopher May (chrismayla6@zirk.us)'s status on Tuesday, 28-Mar-2023 07:39:46 UTC Emeritus Prof Christopher May Emeritus Prof Christopher May

    Two centuries of #bankfailures in a single chart... and the extraordinary period of stability between 1950 & 1970.

    Whatever #bankers may claim about the 'problem' of regulation & the hand of the state, as @RichardJMurphy pointed out this morning - this is the period where Kenynsianism shaped public policy & delivered financial stability...

    If you wanted an illustration of why #capitalism works best when it is regulated carefully, this would be it.

    In conversation Tuesday, 28-Mar-2023 07:39:46 UTC from zirk.us permalink
  • Help
  • About
  • FAQ
  • Privacy
  • Source
  • Version
  • Contact

Bobinas P4G is a social network. It runs on GNU social, version 2.0.1-beta0, available under the GNU Affero General Public License.

Creative Commons Attribution 3.0 All Bobinas P4G content and data are available under the Creative Commons Attribution 3.0 license.