Bobinas P4G
  • Login
  • Public

    • Public
    • Groups
    • Popular
    • People

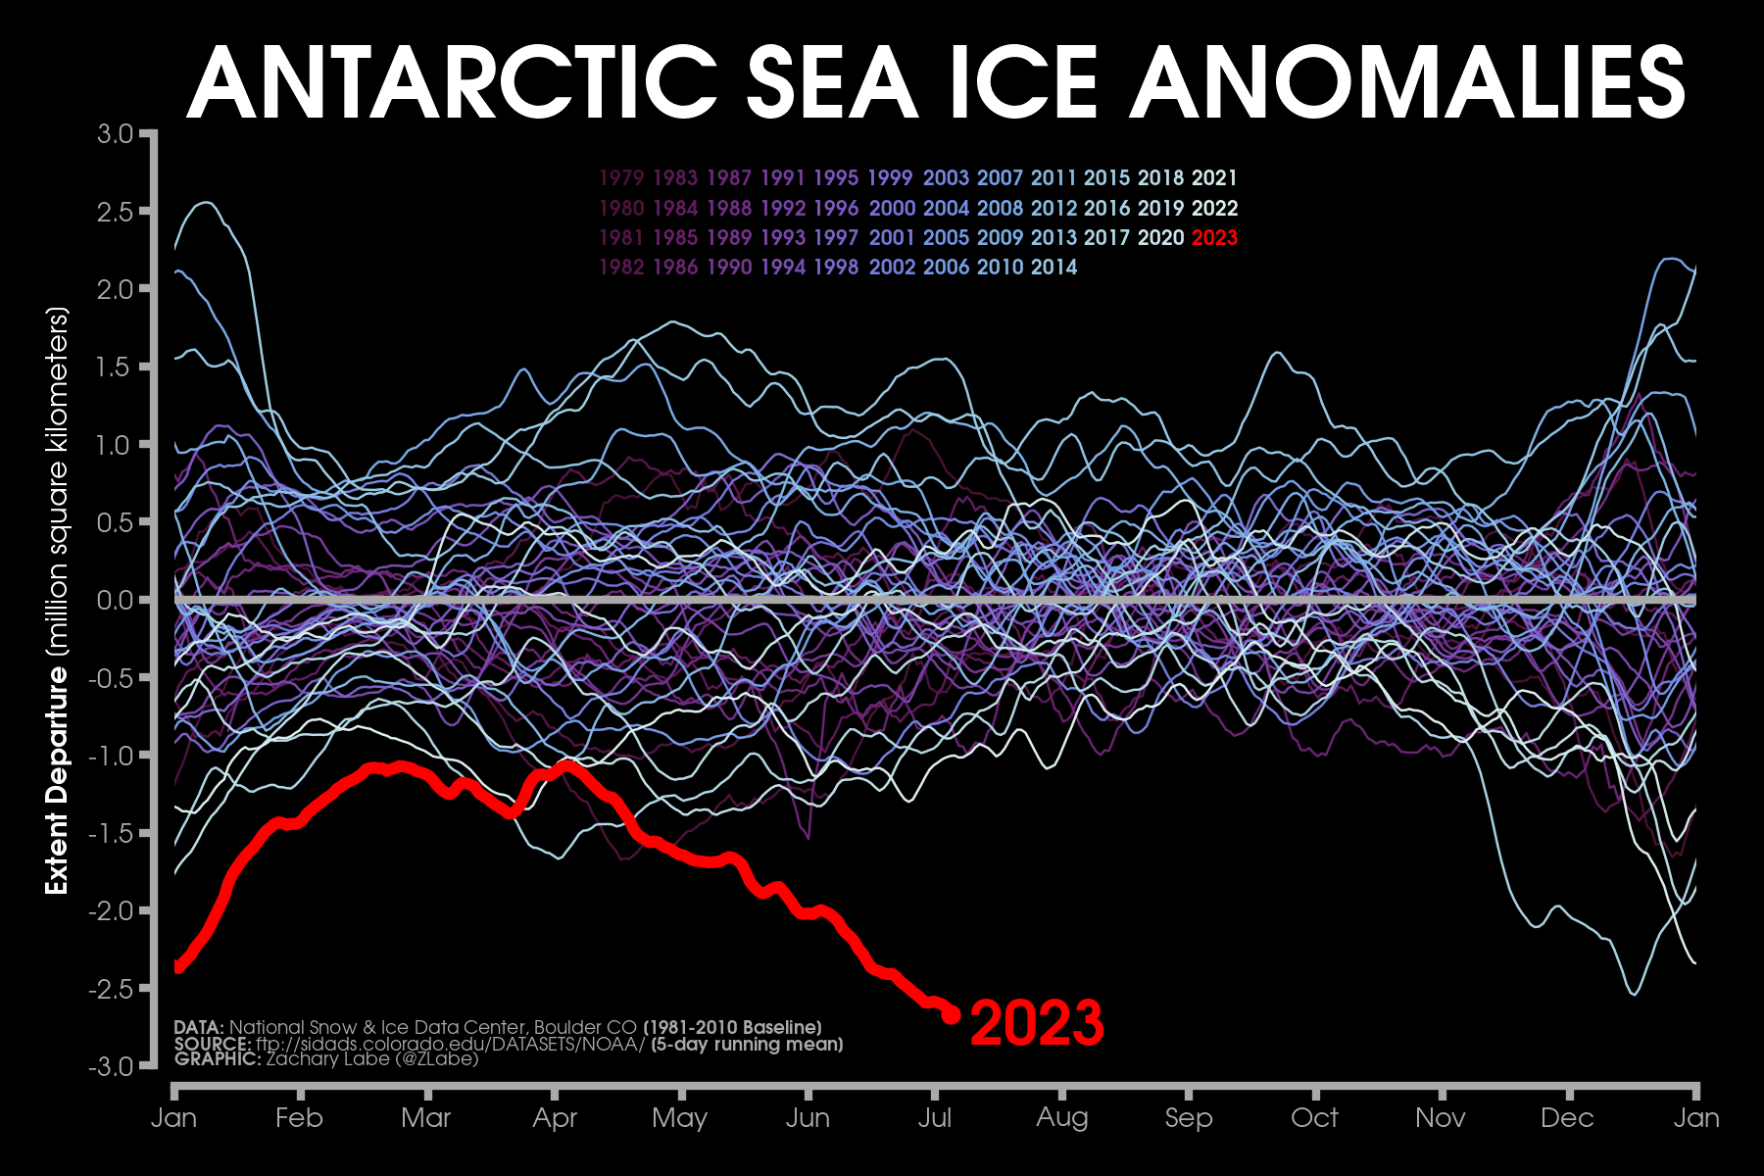
Line graph time series of 2023's daily Antarctic sea ice extent anomalies in red shading compared to each year from 1979 to 2022 using shades of purple to white for each line. Anomalies are computed relative to a 1981-2010 baseline. 2023 is a negative outlier for this time of year. There is substantial interannual and daily variability. There are no clear long-term trends.

Download link

https://fediscience.org/system/media_attachments/files/110/668/268/978/221/244/original/edf32b2053e8a069.png

Notices where this attachment appears

  1. Zack Labe (zlabe@fediscience.org)'s status on Thursday, 06-Jul-2023 23:11:42 UTC Zack Labe Zack Labe

    With ice growth remaining slow, the record #Antarctic sea ice anomaly (negative departure from average) continues to somehow get larger in size...

    Seasonal cycle graphs at https://zacklabe.com/antarctic-sea-ice-extentconcentration/. More info at http://nsidc.org/arcticseaicenews/2023/07/mid-summer-bliss/.

    In conversation Thursday, 06-Jul-2023 23:11:42 UTC from fediscience.org permalink
  • Help
  • About
  • FAQ
  • Privacy
  • Source
  • Version
  • Contact

Bobinas P4G is a social network. It runs on GNU social, version 2.0.1-beta0, available under the GNU Affero General Public License.

Creative Commons Attribution 3.0 All Bobinas P4G content and data are available under the Creative Commons Attribution 3.0 license.