Bobinas P4G
  • Login
  • Public

    • Public
    • Groups
    • Popular
    • People

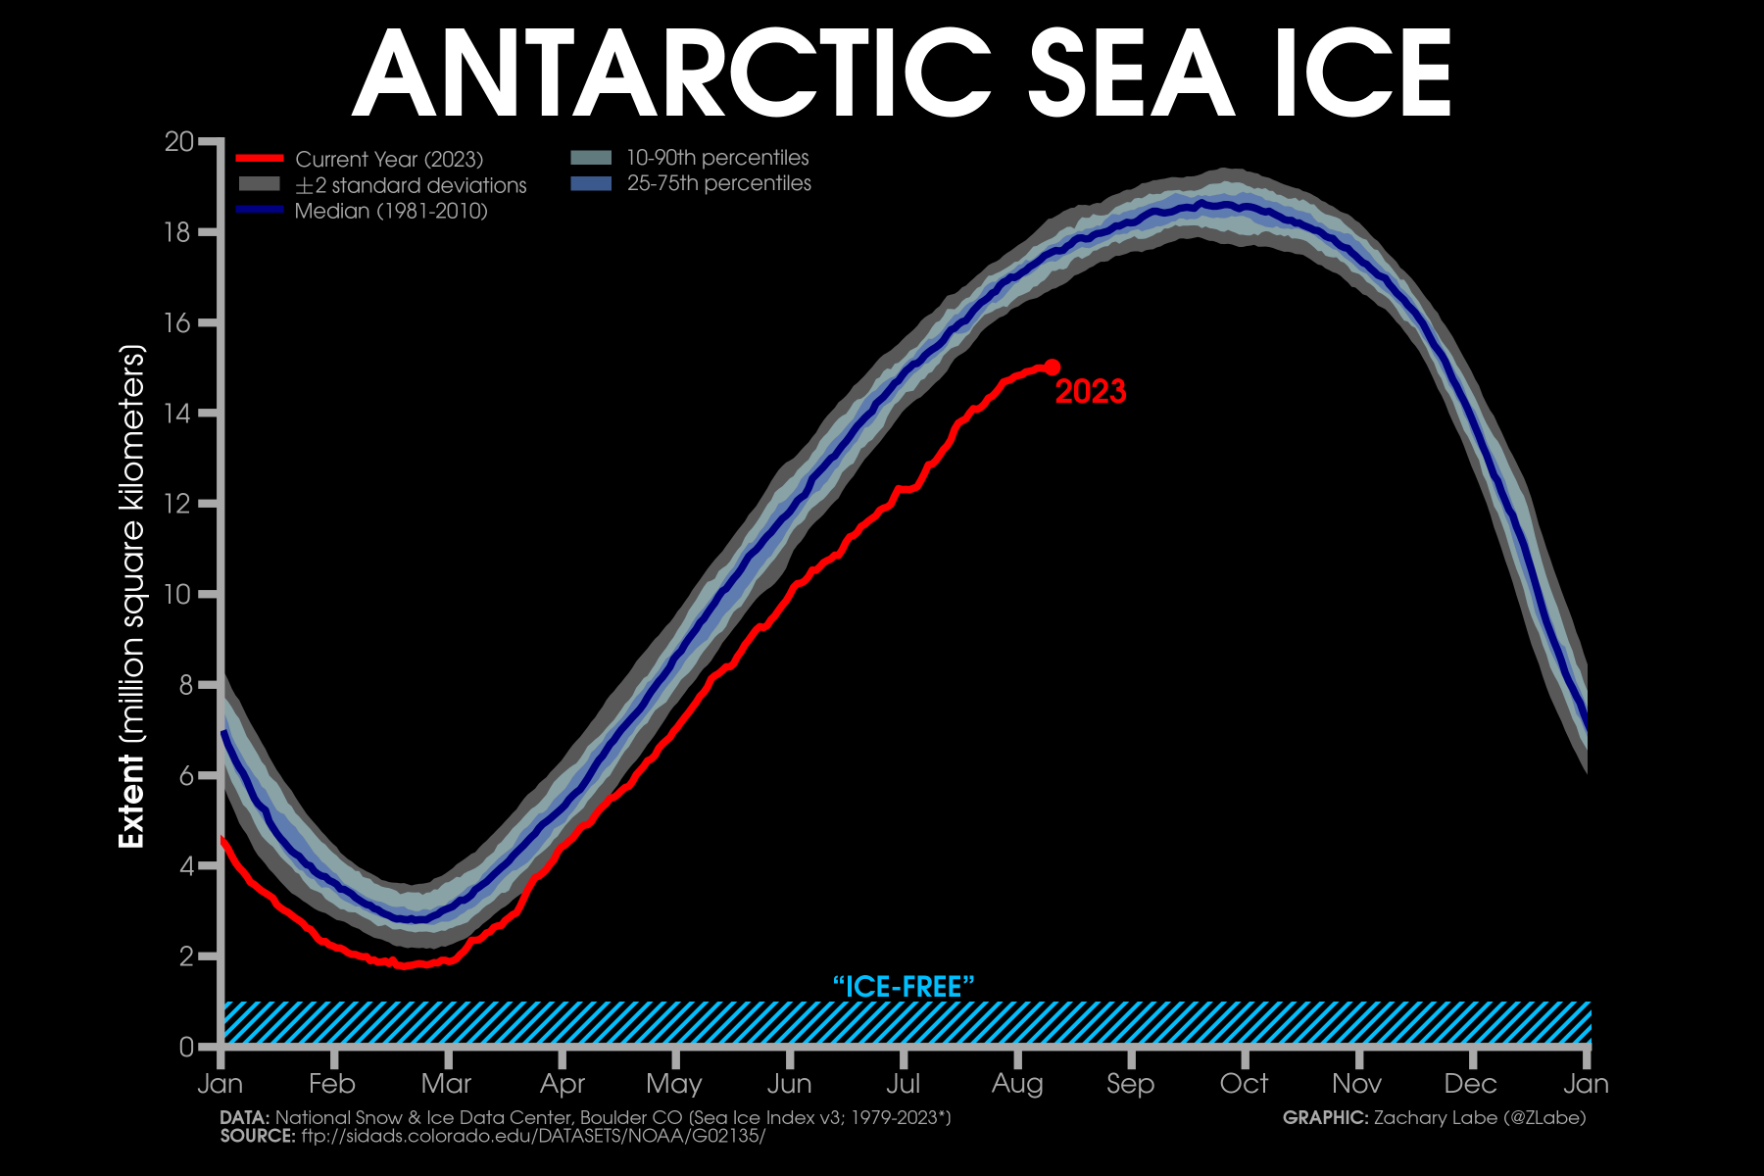
Line graph time series of 2023's daily Antarctic sea ice extent compared to 1981-2010 climatological statistics. The graph shows the seasonal cycle from January to December. Sea ice is currently well outside the climatological averages for mid August and the lowest on record for the time of year.

Download link

https://fediscience.org/system/media_attachments/files/110/878/661/906/821/821/original/867e14da89ad0f85.png

Notices where this attachment appears

  1. Zack Labe (zlabe@fediscience.org)'s status on Saturday, 12-Aug-2023 21:05:24 UTC Zack Labe Zack Labe

    The rate of #Antarctic sea ice growth has slowed down even more in the last few days...

    More visualizations at: https://zacklabe.com/antarctic-sea-ice-extentconcentration/. More information on this extreme event at: https://zacklabe.com/climate-viz-of-the-month/ and https://youtube.com/watch?v=ZFHKZMprEOU&t=1s&ab_channel=DrGilbz.

    In conversation Saturday, 12-Aug-2023 21:05:24 UTC from fediscience.org permalink
  • Help
  • About
  • FAQ
  • Privacy
  • Source
  • Version
  • Contact

Bobinas P4G is a social network. It runs on GNU social, version 2.0.1-beta0, available under the GNU Affero General Public License.

Creative Commons Attribution 3.0 All Bobinas P4G content and data are available under the Creative Commons Attribution 3.0 license.