Bobinas P4G
  • Login
  • Public

    • Public
    • Groups
    • Popular
    • People

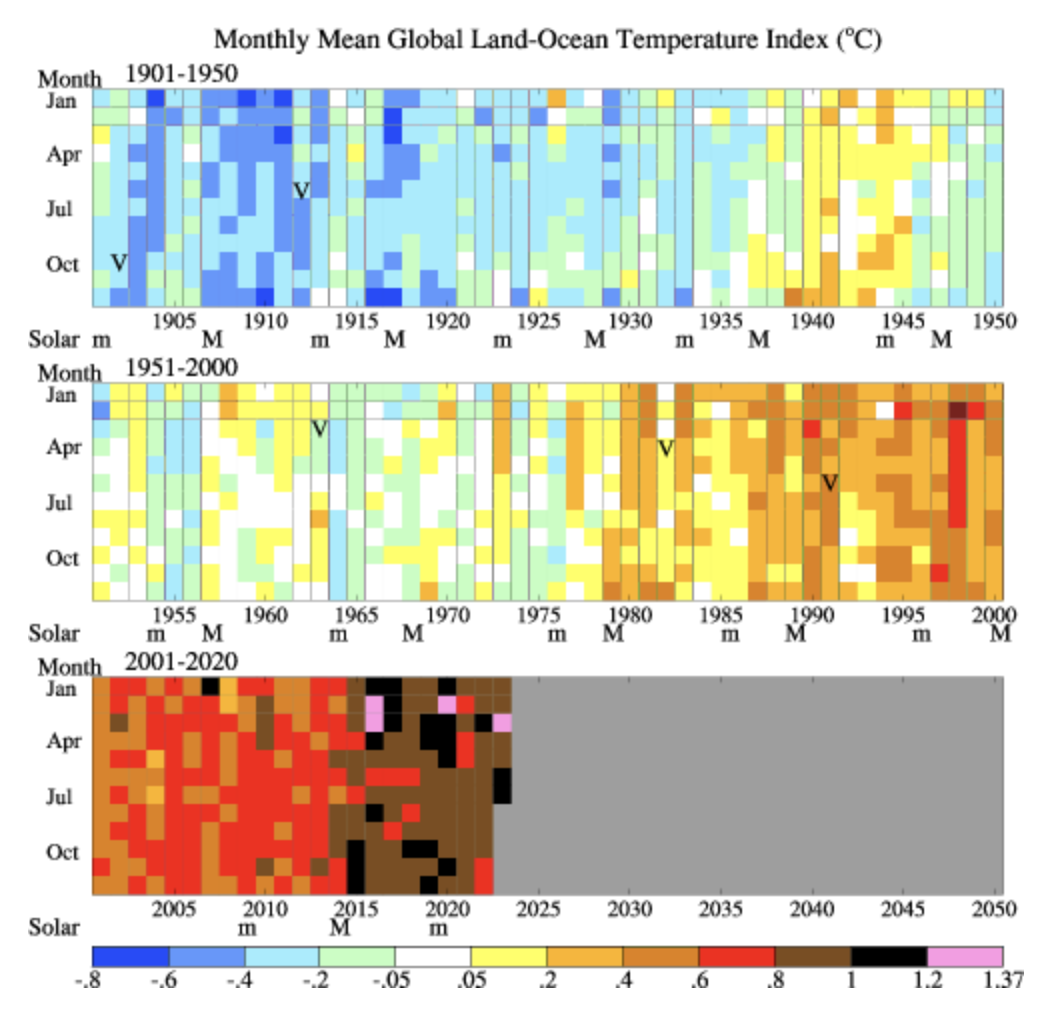
Heat map-style graphic showing monthly global mean surface air temperature anomalies for every month from January 1880 through July 2023. A 'V' symbol is also shown for major volcanic eruptions. A 'm' symbol is shown for solar minima and a 'M' is shown for solar maxima. Every month is observing a long-term warming trend. There is also some interannual variability.

Download link

https://fediscience.org/system/media_attachments/files/110/974/386/609/714/949/original/e5d43ded40f27e06.png

Notices where this attachment appears

  1. Zack Labe (zlabe@fediscience.org)'s status on Tuesday, 29-Aug-2023 19:01:45 UTC Zack Labe Zack Labe

    Global temperature anomalies by month through July 2023. Every month so far this year has been ≥0.87°C above the 1951-1980 climate baseline.

    Note: M = sunspot cycle max, m = sunspot cycle min, V = volcano

    [Data from NASA GISTEMPv4. Visualization prepared by http://columbia.edu/~mhs119/Temperature/T_moreFigs/]

    In conversation Tuesday, 29-Aug-2023 19:01:45 UTC from fediscience.org permalink
  • Help
  • About
  • FAQ
  • Privacy
  • Source
  • Version
  • Contact

Bobinas P4G is a social network. It runs on GNU social, version 2.0.1-beta0, available under the GNU Affero General Public License.

Creative Commons Attribution 3.0 All Bobinas P4G content and data are available under the Creative Commons Attribution 3.0 license.