Bobinas P4G
  • Login
  • Public

    • Public
    • Groups
    • Popular
    • People

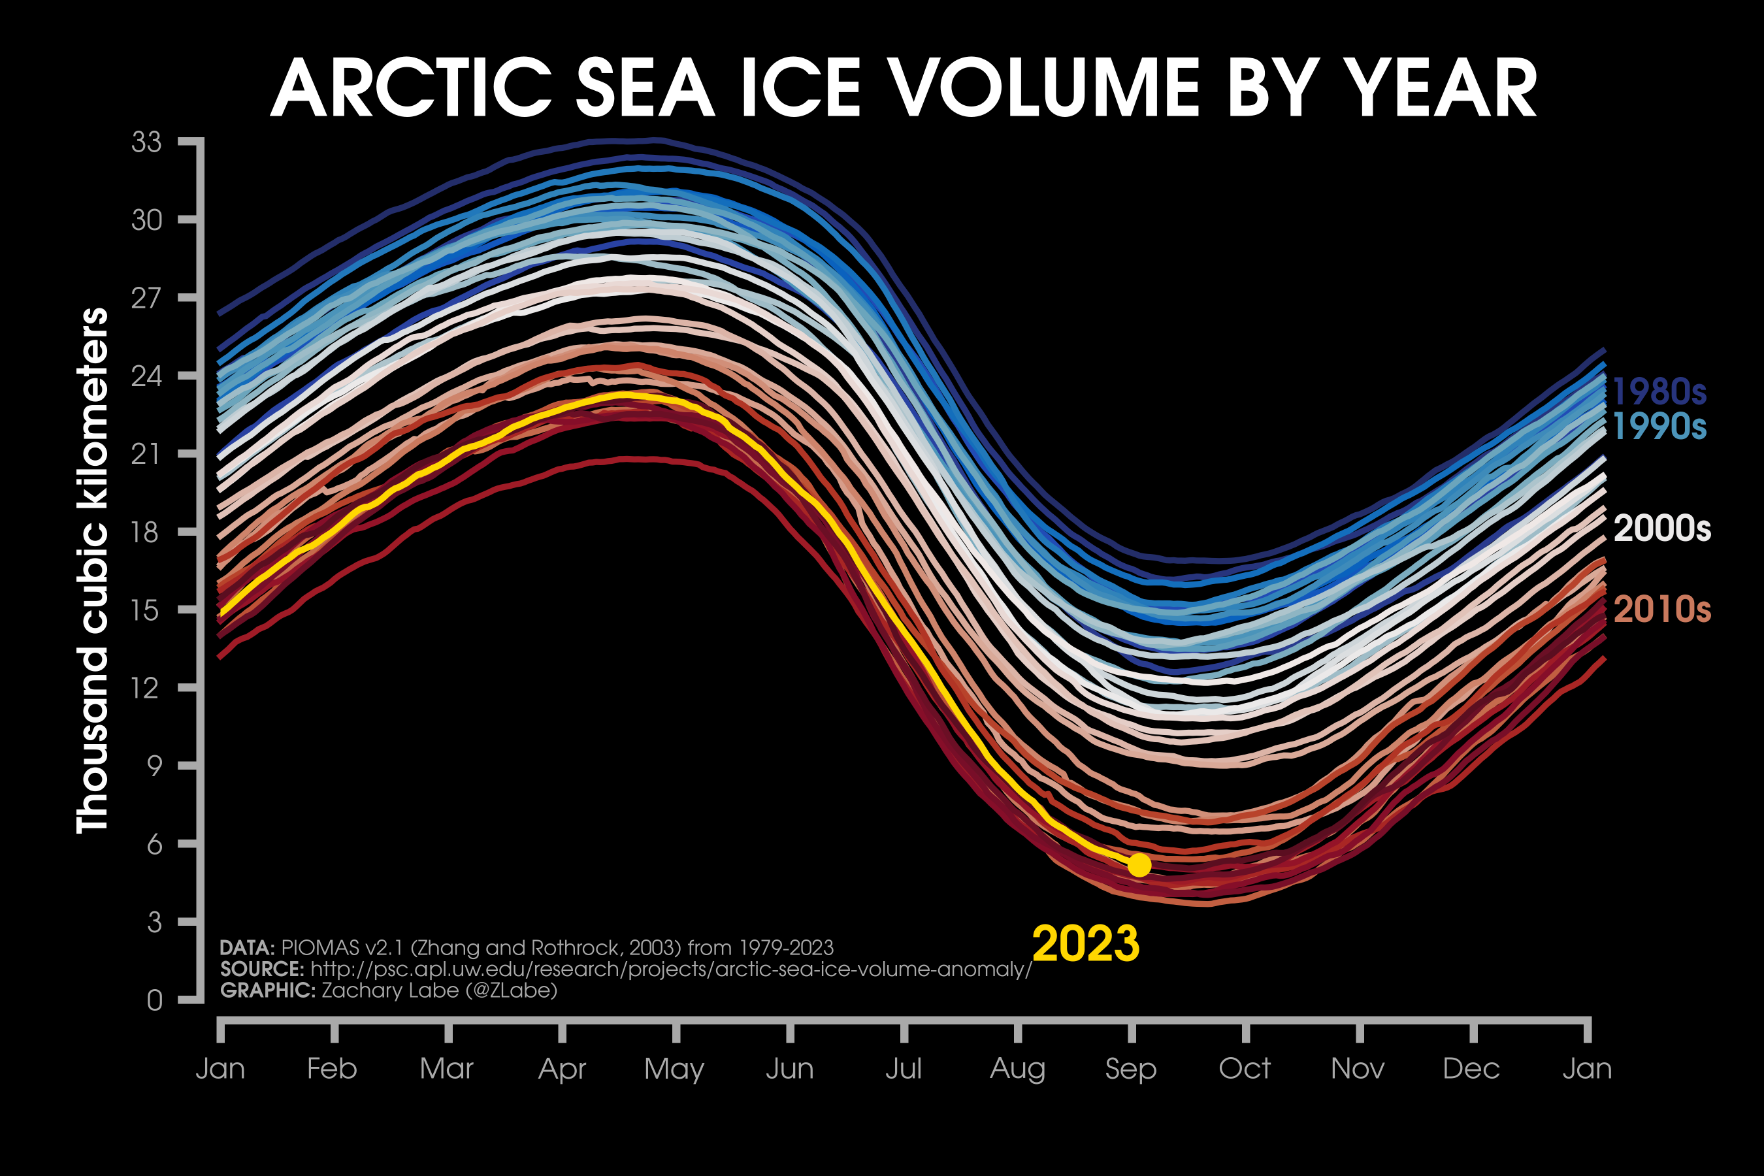
Line graph time series of daily mean Arctic sea ice volume for each year from 1979 to 2023 using shades of red, white and blue. A seasonal cycle is shown with thicker ice in late winter and thinner ice in late summer. A long-term decreasing trend is also visible. Data is from PIOMAS v2.1.

Download link

https://fediscience.org/system/media_attachments/files/111/043/525/875/592/283/original/ccd82e7ad929f940.png

Notices where this attachment appears

  1. Zack Labe (zlabe@fediscience.org)'s status on Monday, 11-Sep-2023 00:23:58 UTC Zack Labe Zack Labe

    Each line represents one year of #Arctic sea ice volume from 1979 [dark blue] to 2022 [dark red]. This year is shown in yellow - now updated through all of August 2023

    + More visuals of ice thickness: https://zacklabe.com/arctic-sea-ice-volumethickness/

    In conversation Monday, 11-Sep-2023 00:23:58 UTC from fediscience.org permalink
  • Help
  • About
  • FAQ
  • Privacy
  • Source
  • Version
  • Contact

Bobinas P4G is a social network. It runs on GNU social, version 2.0.1-beta0, available under the GNU Affero General Public License.

Creative Commons Attribution 3.0 All Bobinas P4G content and data are available under the Creative Commons Attribution 3.0 license.