Bobinas P4G
  • Login
  • Public

    • Public
    • Groups
    • Popular
    • People

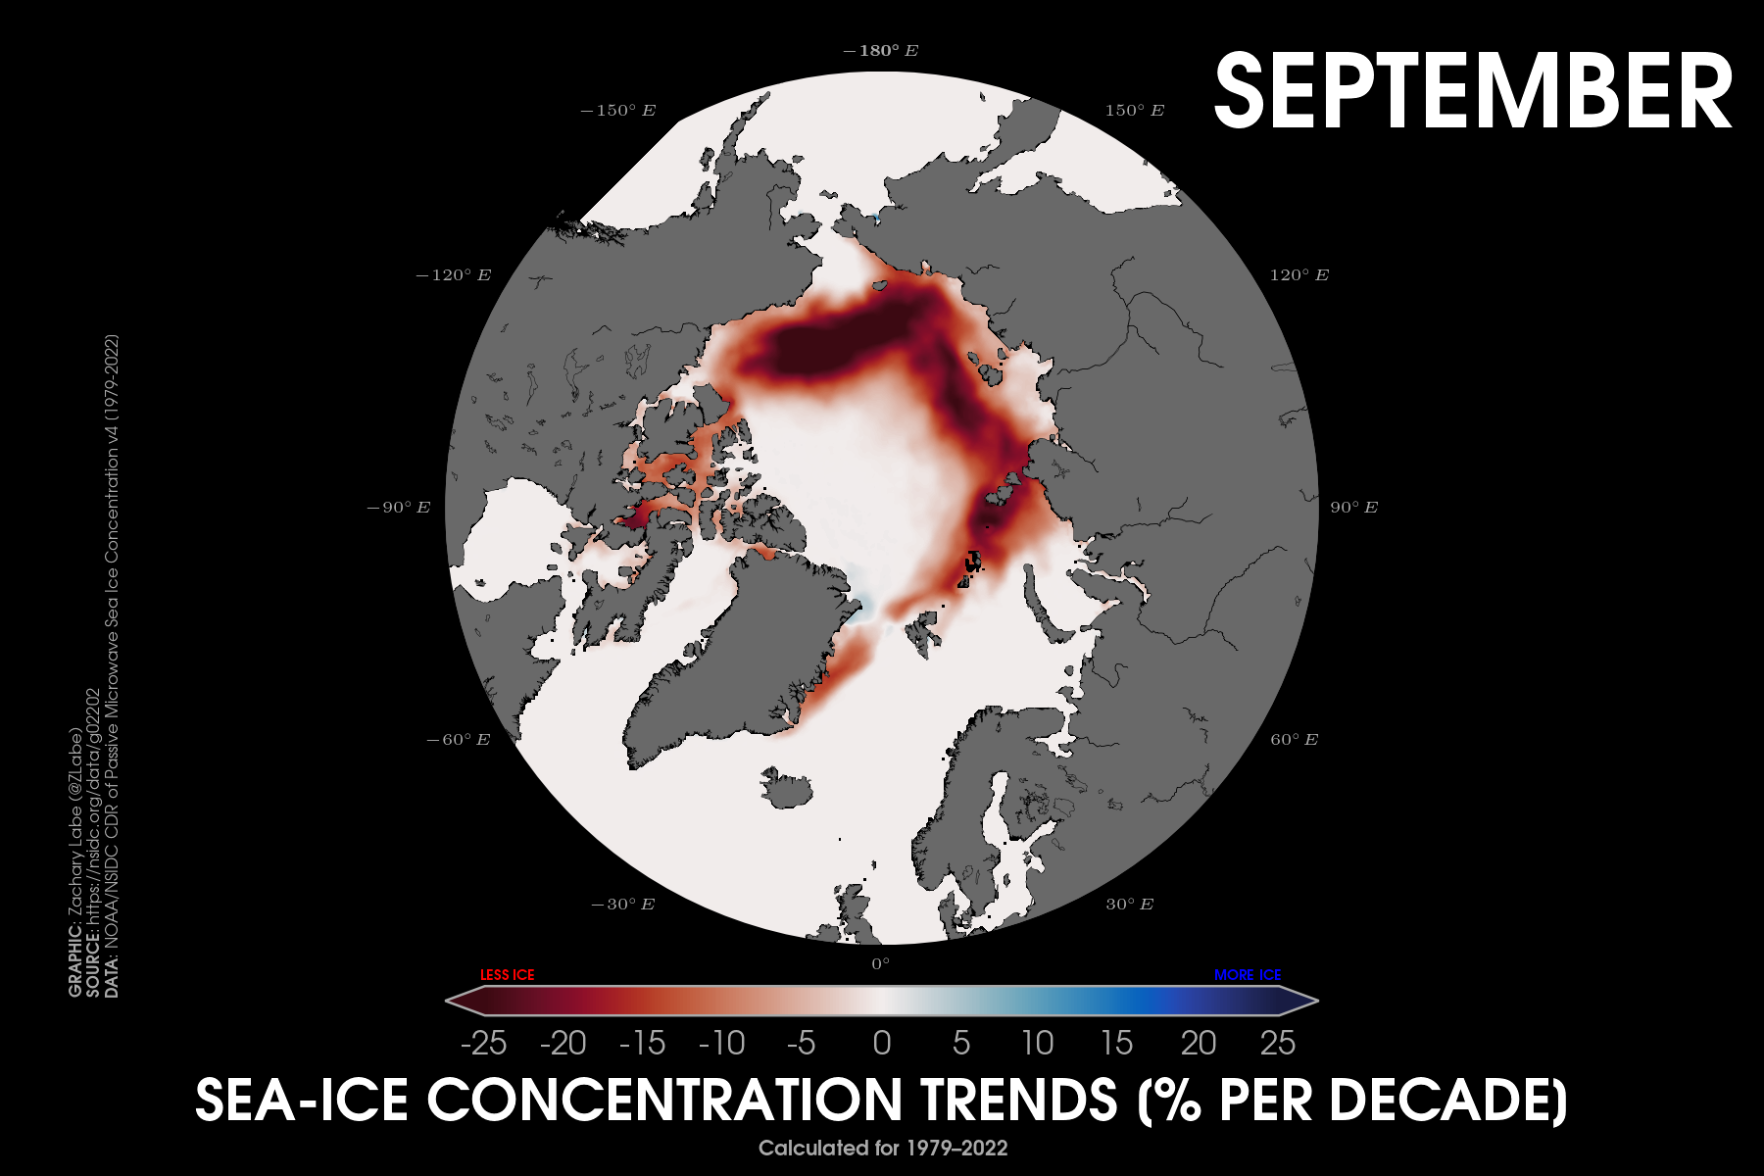
Polar stereographic map showing Arctic sea ice concentration trends for Septembers from 1979 to 2022. Red shading is shown for deceasing sea ice, and blue shading is shown for increasing sea ice. Trends are calculated in % per decade. All areas are observing decreasing sea ice in the outer edges of the Arctic Ocean.

Download link

https://fediscience.org/system/media_attachments/files/111/144/378/383/412/602/original/89387074ad994417.png

Notices where this attachment appears

  1. Zack Labe (zlabe@fediscience.org)'s status on Friday, 29-Sep-2023 00:18:28 UTC Zack Labe Zack Labe
    in reply to

    September also observes the largest losses of #Arctic sea ice concentration compared to any other month of the year. And NO increases. The largest declines are in parts of the Chukchi & Beaufort Seas.

    [Sea ice concentration = fraction of ice-cover. More info: https://doi.org/10.1175/BAMS-D-23-0079.1]

    In conversation Friday, 29-Sep-2023 00:18:28 UTC from fediscience.org permalink
  • Help
  • About
  • FAQ
  • Privacy
  • Source
  • Version
  • Contact

Bobinas P4G is a social network. It runs on GNU social, version 2.0.1-beta0, available under the GNU Affero General Public License.

Creative Commons Attribution 3.0 All Bobinas P4G content and data are available under the Creative Commons Attribution 3.0 license.