Bobinas P4G
  • Login
  • Public

    • Public
    • Groups
    • Popular
    • People

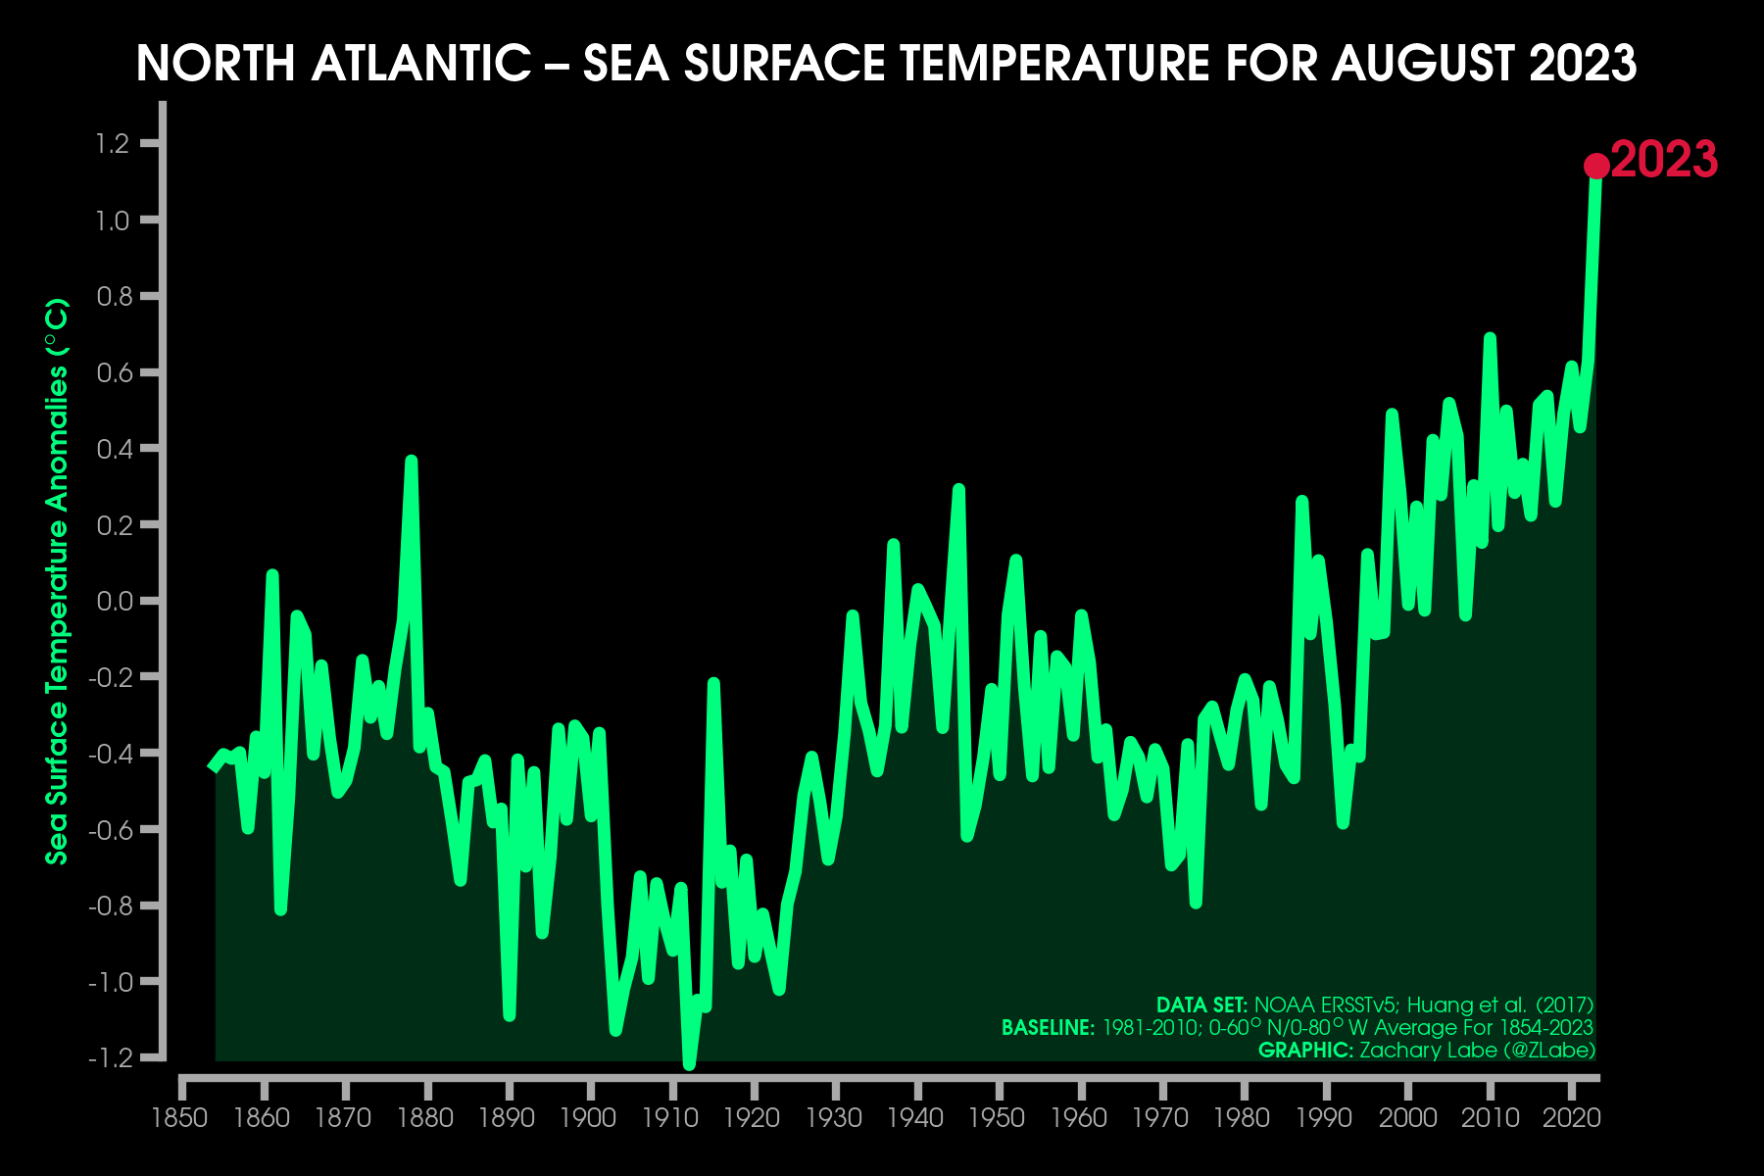
Green line graph time series of average sea surface temperature anomalies for each August from 1850 through 2023 for only the North Atlantic. There is large interannual variability, but an overall long-term increasing trend. Anomalies are computed relative to a 1981-2010 baseline. 2023 is easily the warmest on record.

Download link

https://fediscience.org/system/media_attachments/files/111/157/197/217/661/291/original/221390dcddffce3e.png

Notices where this attachment appears

  1. Zack Labe (zlabe@fediscience.org)'s status on Sunday, 01-Oct-2023 02:26:38 UTC Zack Labe Zack Labe

    Oh look, another absurd climate graph from this summer - sea surface temperature anomalies in the North Atlantic for every August since 1854... 🥴

    Data available from NOAA ERSSTv5 (https://psl.noaa.gov/data/gridded/data.noaa.ersst.v5.html).

    In conversation Sunday, 01-Oct-2023 02:26:38 UTC from fediscience.org permalink
  • Help
  • About
  • FAQ
  • Privacy
  • Source
  • Version
  • Contact

Bobinas P4G is a social network. It runs on GNU social, version 2.0.1-beta0, available under the GNU Affero General Public License.

Creative Commons Attribution 3.0 All Bobinas P4G content and data are available under the Creative Commons Attribution 3.0 license.