Bobinas P4G
  • Login
  • Public

    • Public
    • Groups
    • Popular
    • People

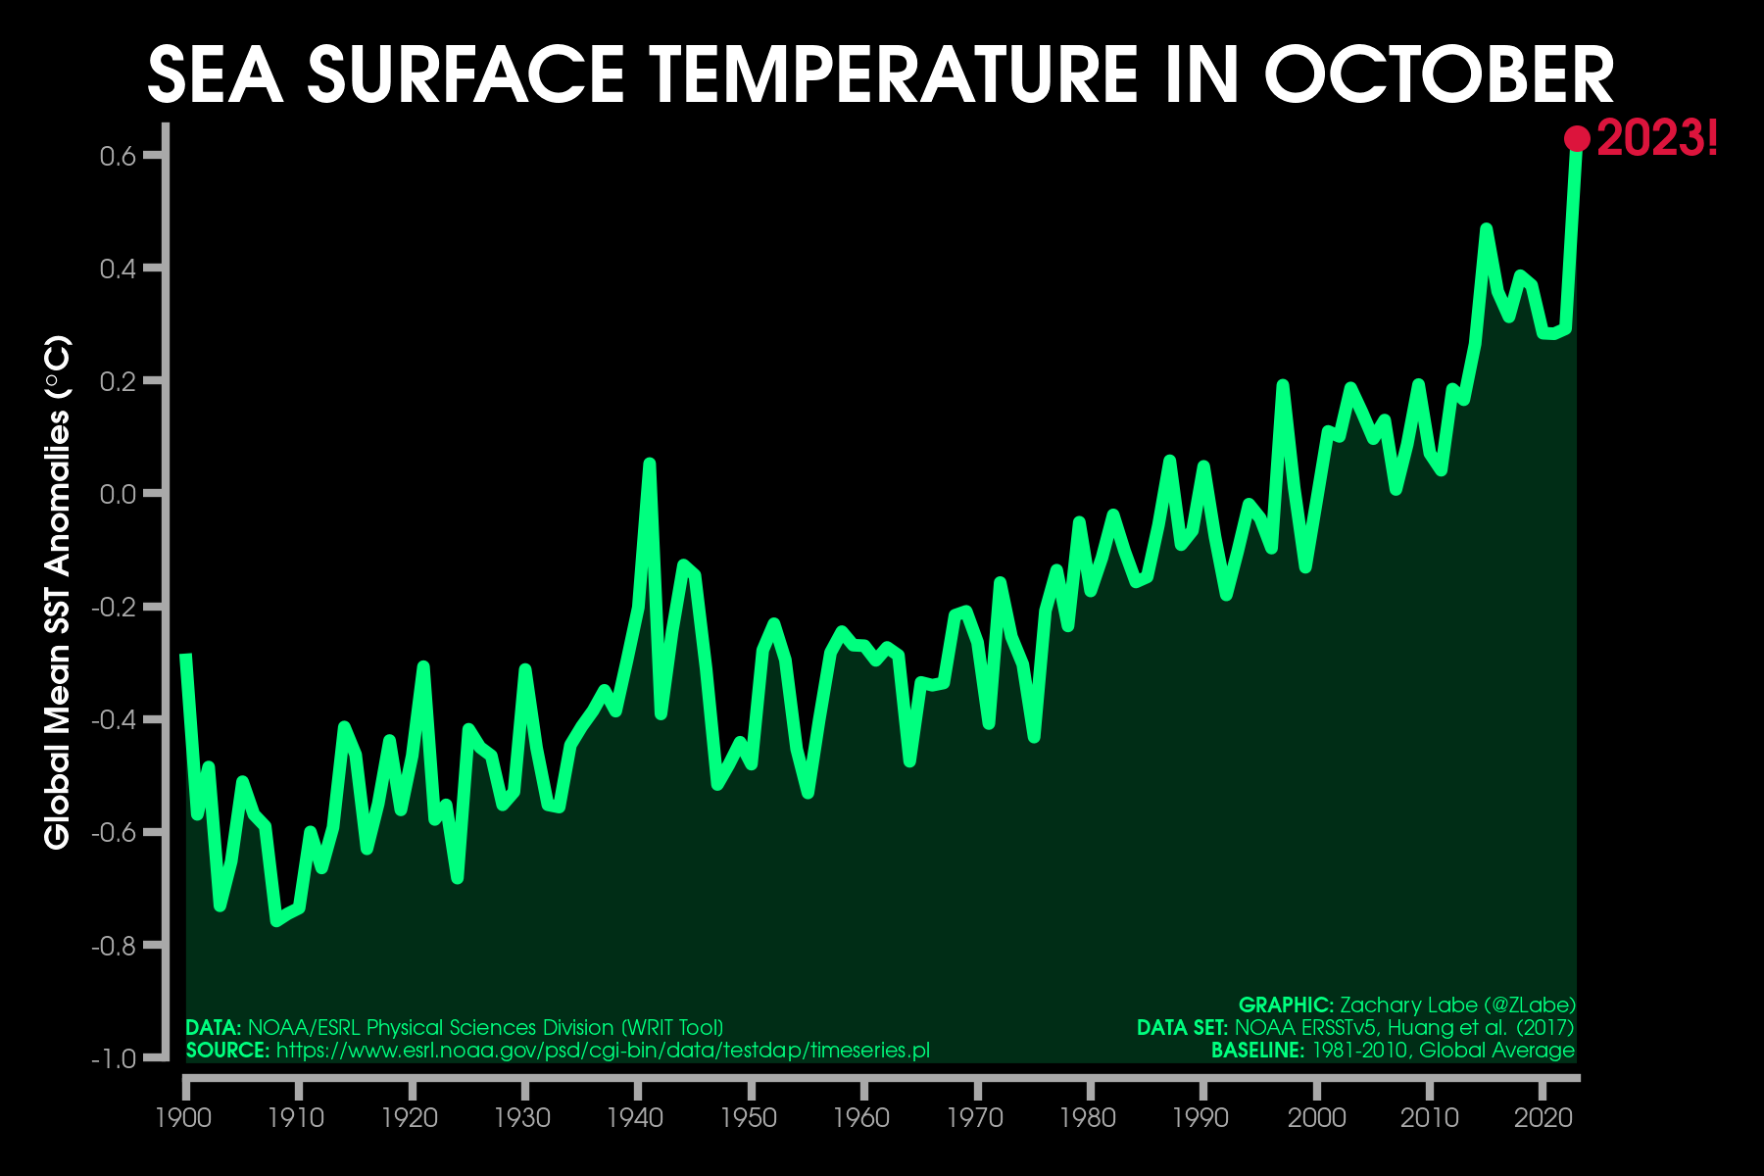
Green line graph time series of average sea surface temperature anomalies for each October from 1900 through 2023. There is large interannual variability, but an overall long-term increasing trend. Anomalies are computed relative to a 1981-2010 baseline.

Download link

https://fediscience.org/system/media_attachments/files/111/358/374/225/938/314/original/24082ba918a4c78f.png

Notices where this attachment appears

  1. Zack Labe (zlabe@fediscience.org)'s status on Sunday, 05-Nov-2023 15:22:11 UTC Zack Labe Zack Labe

    October continued to set another striking record for globally-averaged sea surface temperatures...

    Data available from NOAA ERSSTv5 (https://psl.noaa.gov/data/gridded/data.noaa.ersst.v5.html). Methods detailed in https://doi.org/10.1175/JCLI-D-16-0836.1.

    In conversation Sunday, 05-Nov-2023 15:22:11 UTC from fediscience.org permalink
  • Help
  • About
  • FAQ
  • Privacy
  • Source
  • Version
  • Contact

Bobinas P4G is a social network. It runs on GNU social, version 2.0.1-beta0, available under the GNU Affero General Public License.

Creative Commons Attribution 3.0 All Bobinas P4G content and data are available under the Creative Commons Attribution 3.0 license.