Bobinas P4G
  • Login
  • Public

    • Public
    • Groups
    • Popular
    • People

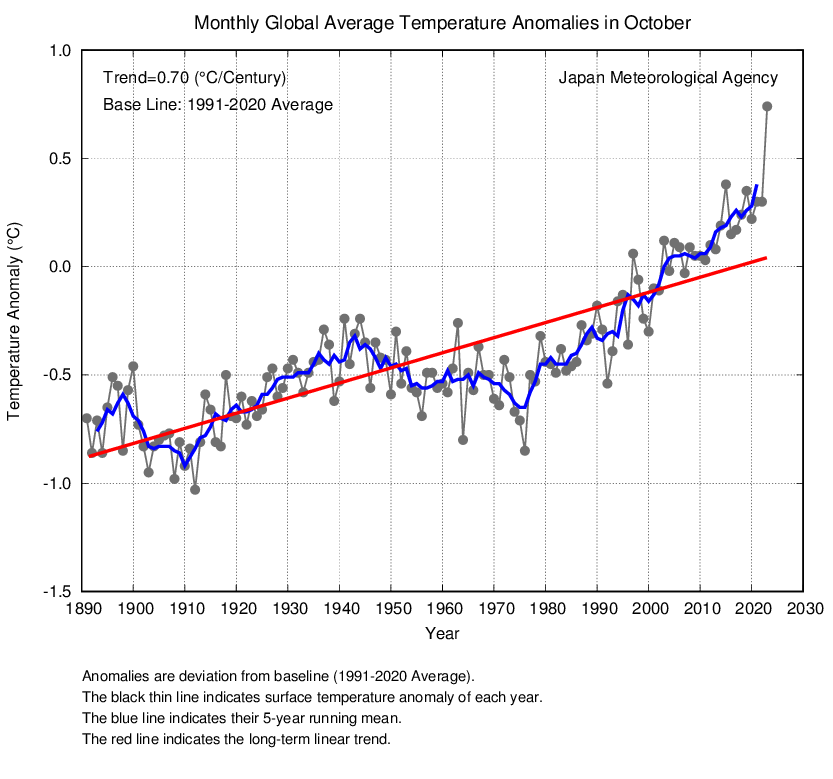
Line graph time series of global mean surface air temperature anomalies for every October from 1891 through 2023. There is a long-term warming trend. A 5-year running mean and long-term linear trend are also displayed on this graph. Anomalies are computed relative to a 1991 to 2020 baseline.

Download link

https://fediscience.org/system/media_attachments/files/111/410/554/466/853/290/original/147ce5d7f89524d2.png

Notices where this attachment appears

  1. Zack Labe (zlabe@fediscience.org)'s status on Tuesday, 14-Nov-2023 21:16:23 UTC Zack Labe Zack Labe

    Top 5 warmest October global temperatures since at least 1891 - using data from the Japan Meteorological Agency (https://ds.data.jma.go.jp/tcc/tcc/products/gwp/temp/oct_wld.html)...

    1. *2023*
    2. 2015
    3. 2019
    4. 2022/2021

    No, I did not make this graph, so plz don't complain to me about the regression line.

    In conversation Tuesday, 14-Nov-2023 21:16:23 UTC from fediscience.org permalink
  • Help
  • About
  • FAQ
  • Privacy
  • Source
  • Version
  • Contact

Bobinas P4G is a social network. It runs on GNU social, version 2.0.1-beta0, available under the GNU Affero General Public License.

Creative Commons Attribution 3.0 All Bobinas P4G content and data are available under the Creative Commons Attribution 3.0 license.