Bobinas P4G
  • Login
  • Public

    • Public
    • Groups
    • Popular
    • People

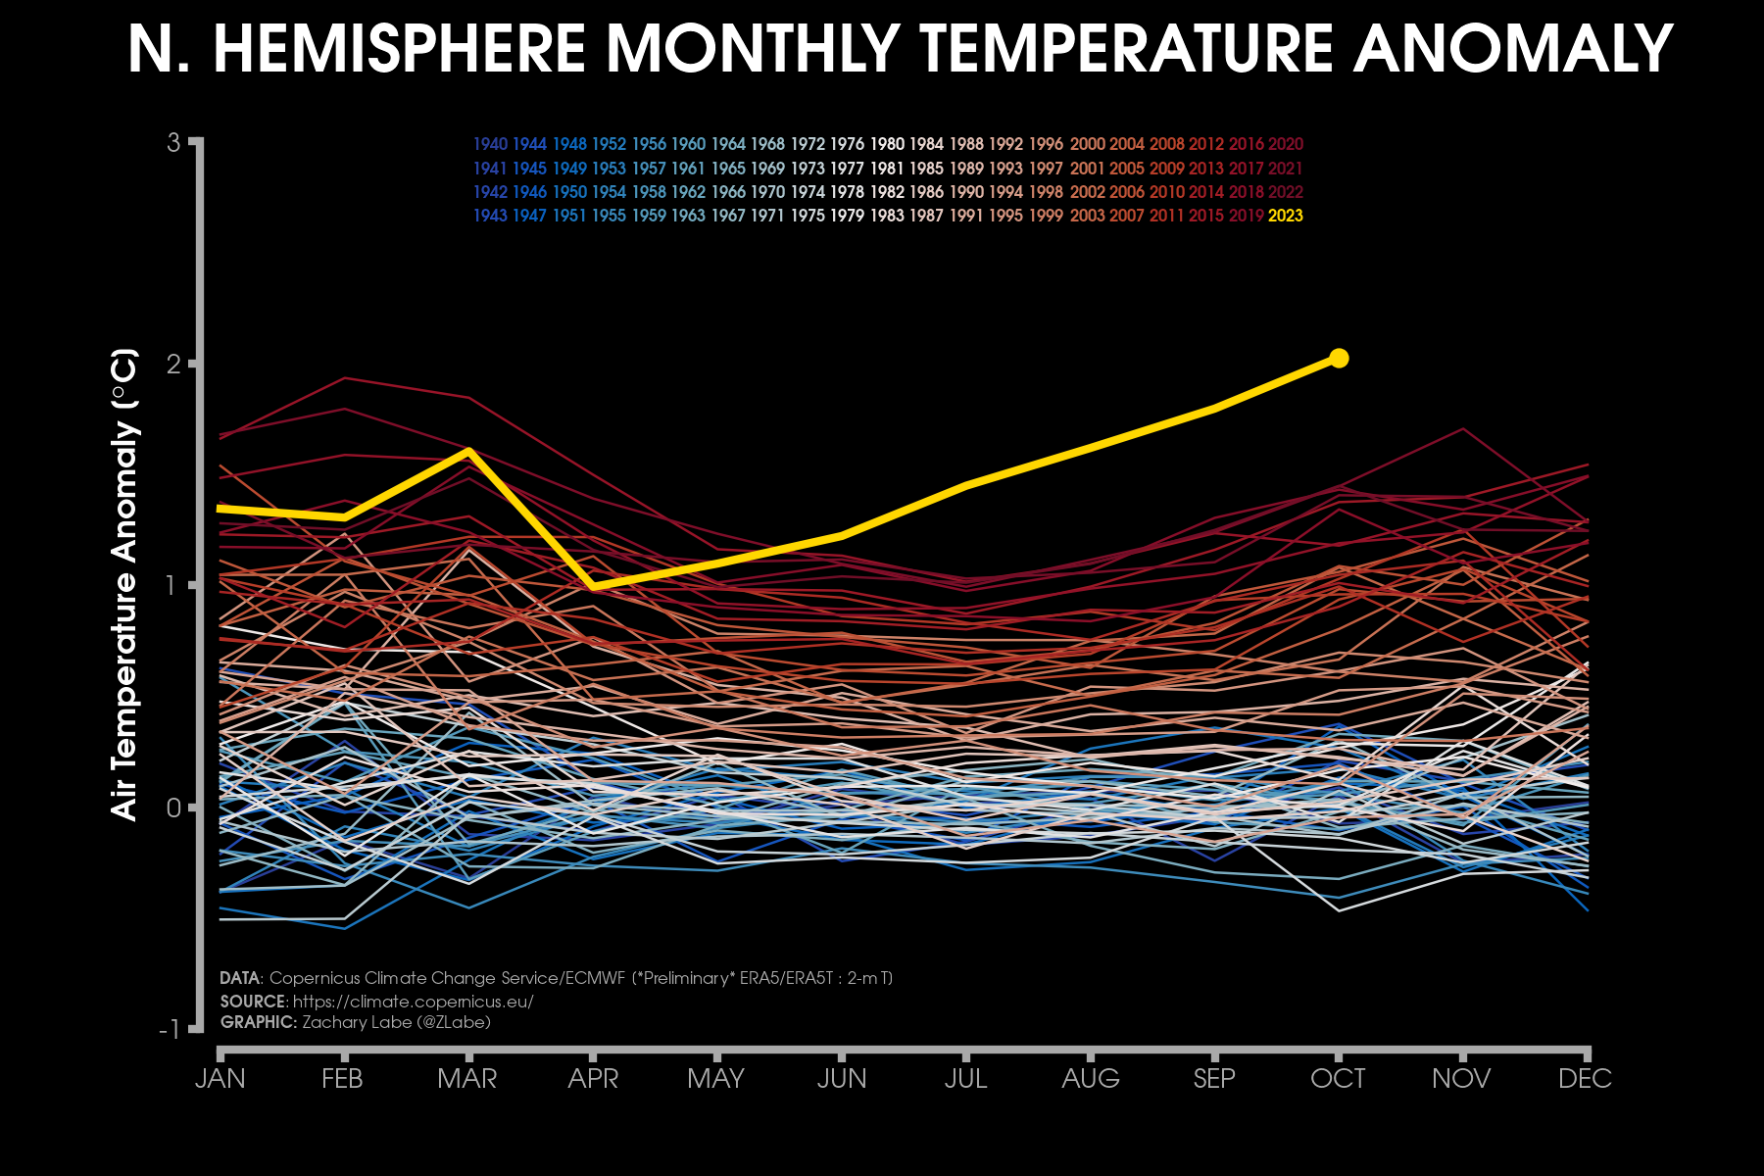
Line graph time series of monthly mean surface temperature anomalies for the Northern Hemisphere region only. Every month is shown from 1940 to 2023. There is a long-term warming trend in all months with an outlier for 2023.

Download link

https://fediscience.org/system/media_attachments/files/111/438/952/740/898/406/original/a920f7402cb49a90.png

Notices where this attachment appears

  1. Zack Labe (zlabe@fediscience.org)'s status on Monday, 20-Nov-2023 02:05:24 UTC Zack Labe Zack Labe

    Last month was the most anomalous on record for temperatures in the Northern Hemisphere...

    Using data from ECMWF ERA5 reanalysis: https://cds.climate.copernicus.eu/cdsapp#!/dataset/reanalysis-era5-single-levels-monthly-means?tab=overview

    In conversation Monday, 20-Nov-2023 02:05:24 UTC from fediscience.org permalink
  • Help
  • About
  • FAQ
  • Privacy
  • Source
  • Version
  • Contact

Bobinas P4G is a social network. It runs on GNU social, version 2.0.1-beta0, available under the GNU Affero General Public License.

Creative Commons Attribution 3.0 All Bobinas P4G content and data are available under the Creative Commons Attribution 3.0 license.