Bobinas P4G
  • Login
  • Public

    • Public
    • Groups
    • Popular
    • People

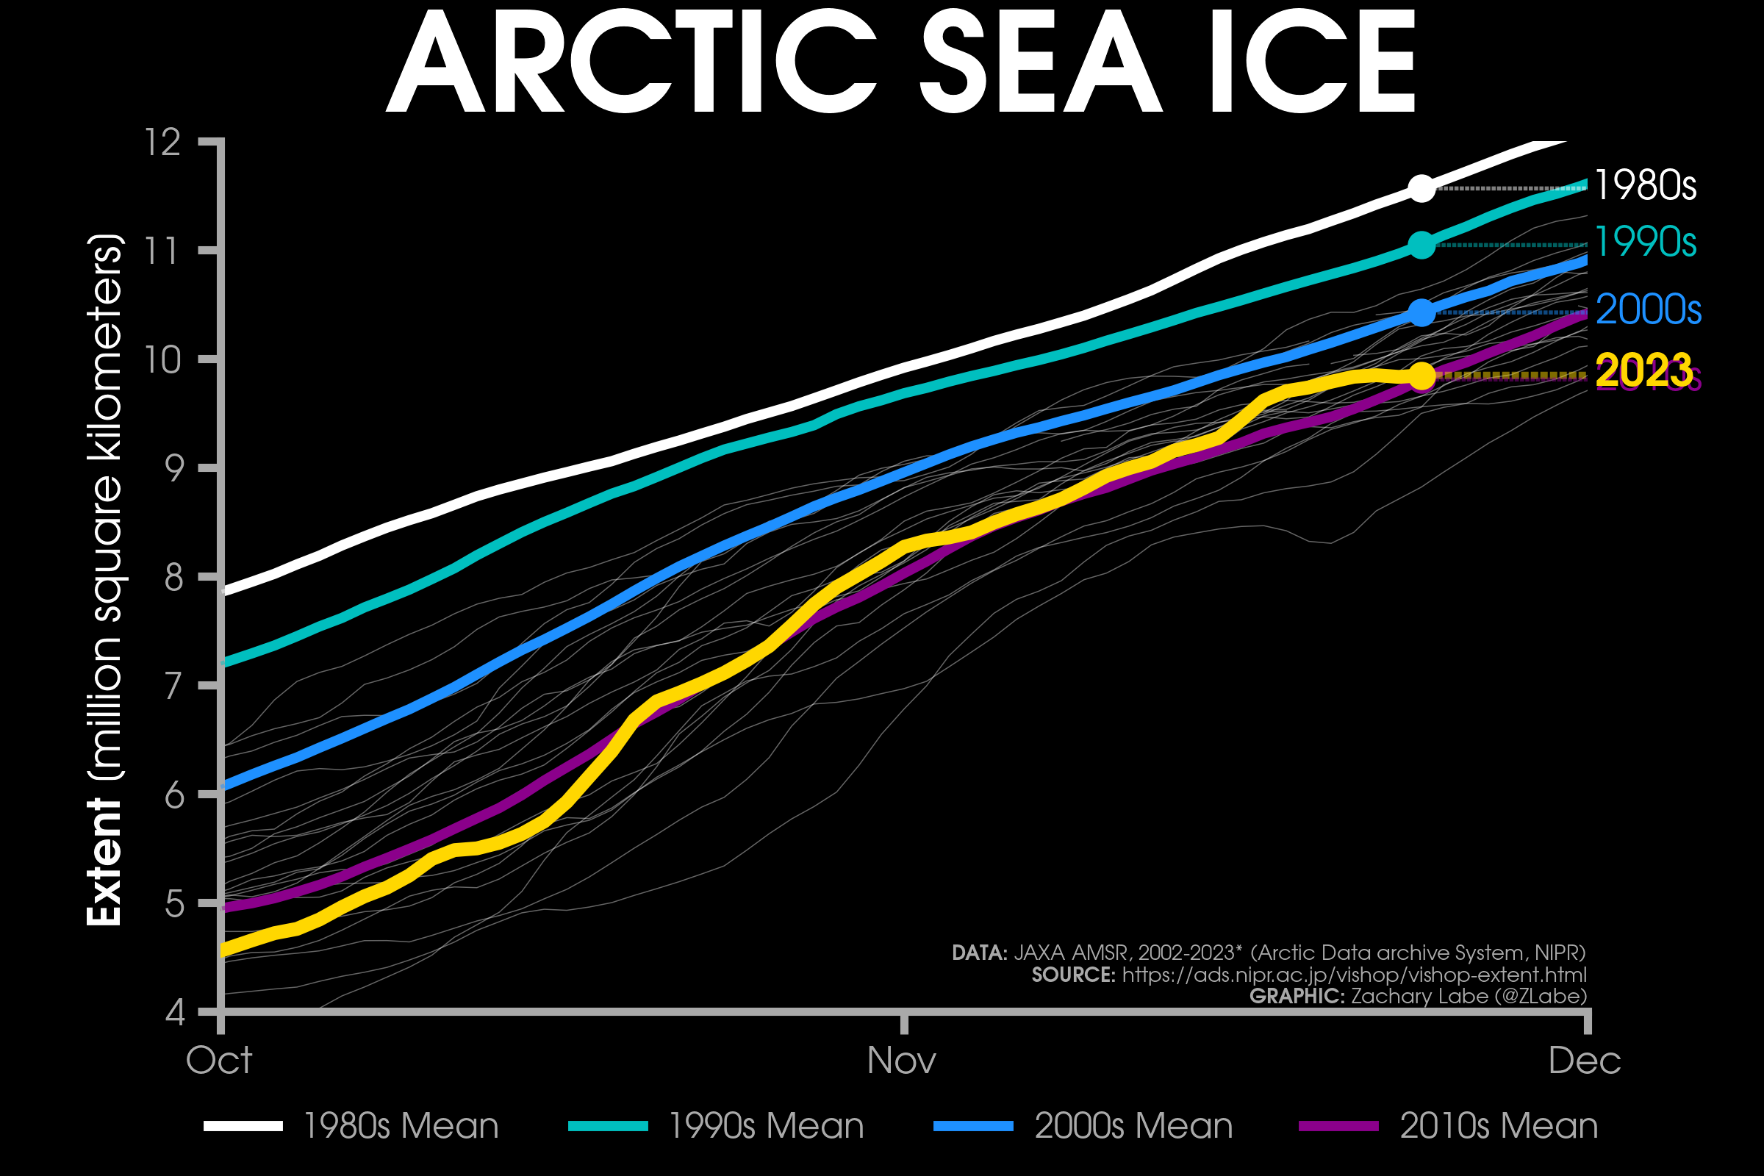
Line graph time series of 2023's daily Arctic sea ice extent compared to decadal averages from the 1980s to the 2010s. The decadal averages are shown with different colored lines with white for the 1980s, green for the 1990s, blue for the 2000s, and purple for the 2010s. Thin white lines are also shown for each year from 2002 to 2022. 2023 is shown with a thick gold line. There is a long-term decreasing trend in ice extent for every day of the year shown on this graph between October and December.

Download link

https://fediscience.org/system/media_attachments/files/111/467/821/360/507/810/original/5e2122ff2ce2944d.png

Notices where this attachment appears

  1. Zack Labe (zlabe@fediscience.org)'s status on Friday, 24-Nov-2023 22:14:28 UTC Zack Labe Zack Labe

    Have a great weekend! Here's your Friday ice update - #Arctic sea ice extent is currently the 8th lowest on record (JAXA data)...

    • about 40,000 km² above the 2010s mean
    • about 580,000 km² below the 2000s mean
    • about 1,200,000 km² below the 1990s mean
    • about 1,720,000 km² below the 1980s mean

    Other climate plots: https://zacklabe.com/arctic-sea-ice-extentconcentration/

    In conversation Friday, 24-Nov-2023 22:14:28 UTC from fediscience.org permalink
  • Help
  • About
  • FAQ
  • Privacy
  • Source
  • Version
  • Contact

Bobinas P4G is a social network. It runs on GNU social, version 2.0.1-beta0, available under the GNU Affero General Public License.

Creative Commons Attribution 3.0 All Bobinas P4G content and data are available under the Creative Commons Attribution 3.0 license.