Bobinas P4G
  • Login
  • Public

    • Public
    • Groups
    • Popular
    • People

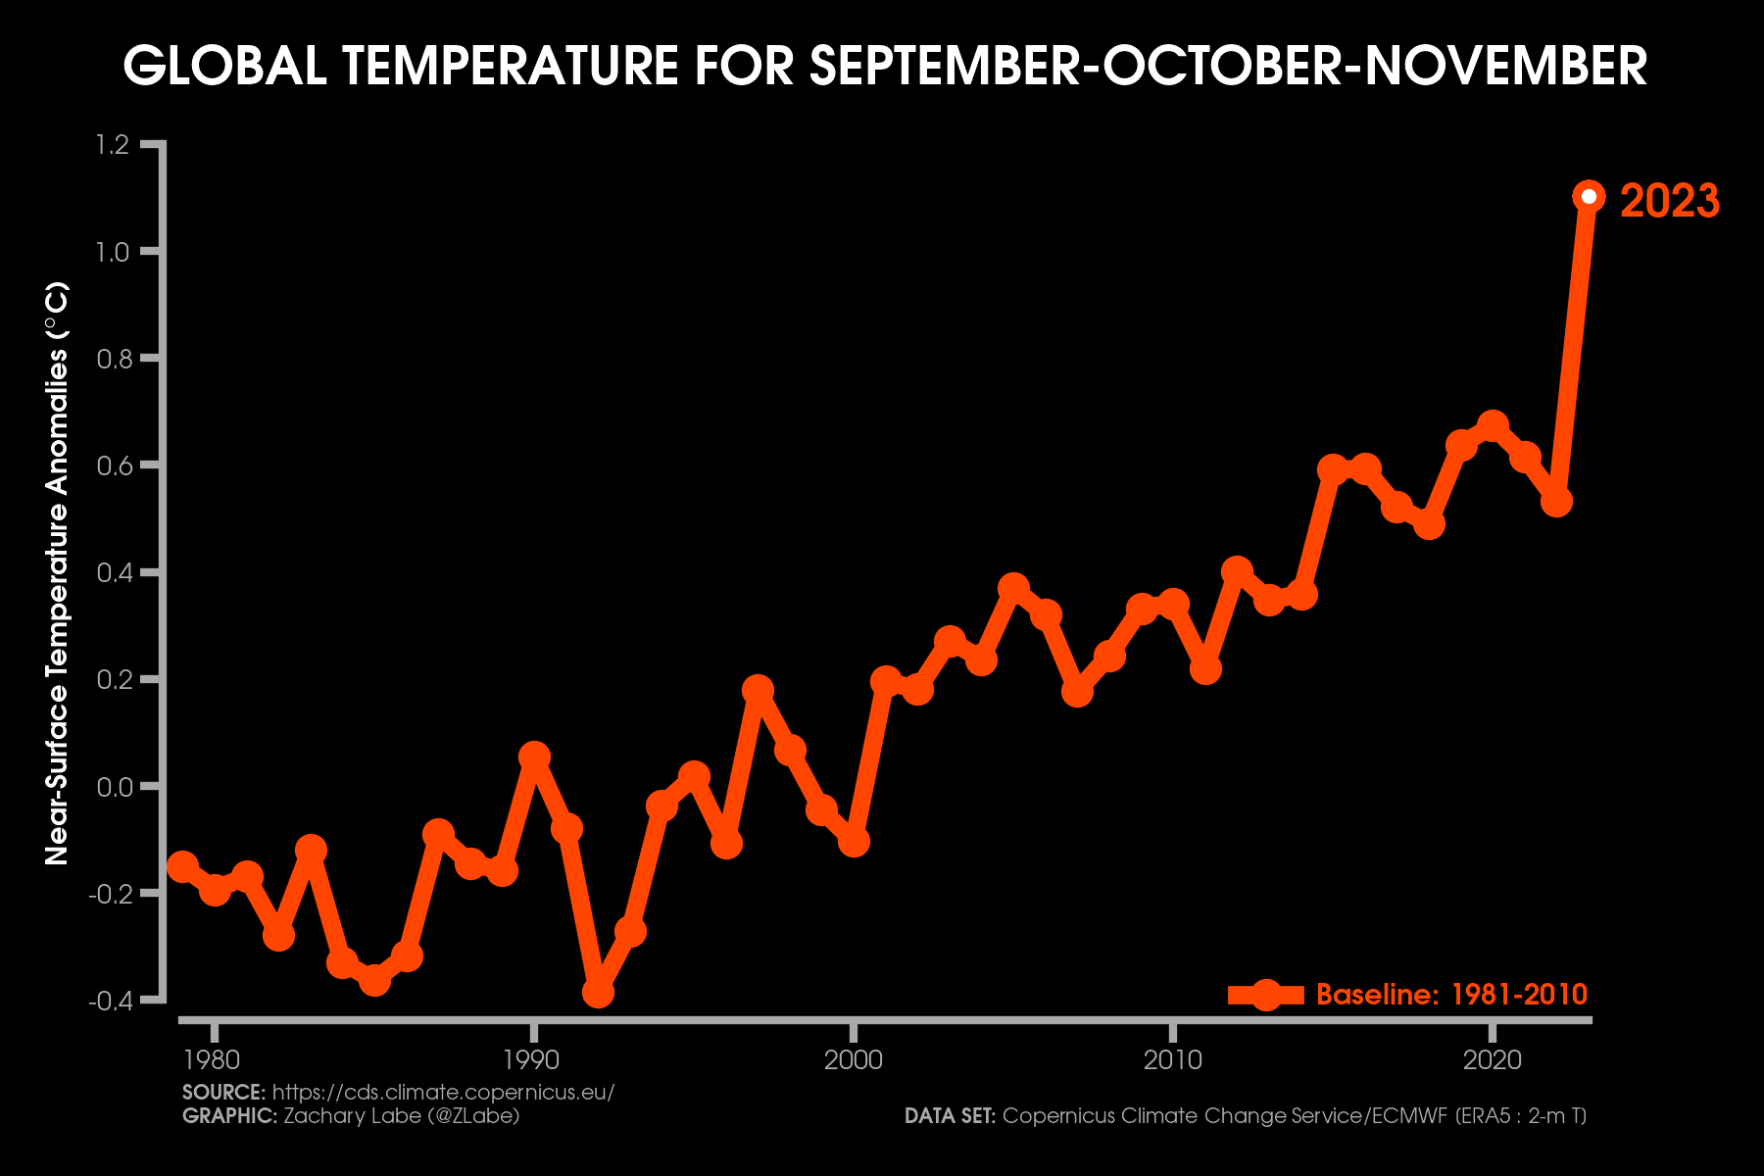
Line graph time series showing the global temperature anomalies for every September to November period from 1979 to 2023. There is interannual variability but a clear long-term increasing trend. 2023 is an outlier and the warmest on record in this time series. Anomalies are computed relative to a 1981-2010 baseline, and all data is from ERA5 reanalysis.

Download link

https://fediscience.org/system/media_attachments/files/111/557/932/360/062/626/original/9790bf9a389686ce.png

Notices where this attachment appears

  1. Zack Labe (zlabe@fediscience.org)'s status on Sunday, 10-Dec-2023 21:36:05 UTC Zack Labe Zack Labe

    Wow, the last three months have really shattered the previous September to November temperature record for our planet...

    Using data from ECMWF ERA5 reanalysis at https://cds.climate.copernicus.eu/cdsapp#!/dataset/reanalysis-era5-single-levels-monthly-means?tab=overview

    In conversation Sunday, 10-Dec-2023 21:36:05 UTC from fediscience.org permalink
  • Help
  • About
  • FAQ
  • Privacy
  • Source
  • Version
  • Contact

Bobinas P4G is a social network. It runs on GNU social, version 2.0.1-beta0, available under the GNU Affero General Public License.

Creative Commons Attribution 3.0 All Bobinas P4G content and data are available under the Creative Commons Attribution 3.0 license.