Bobinas P4G
  • Login
  • Public

    • Public
    • Groups
    • Popular
    • People

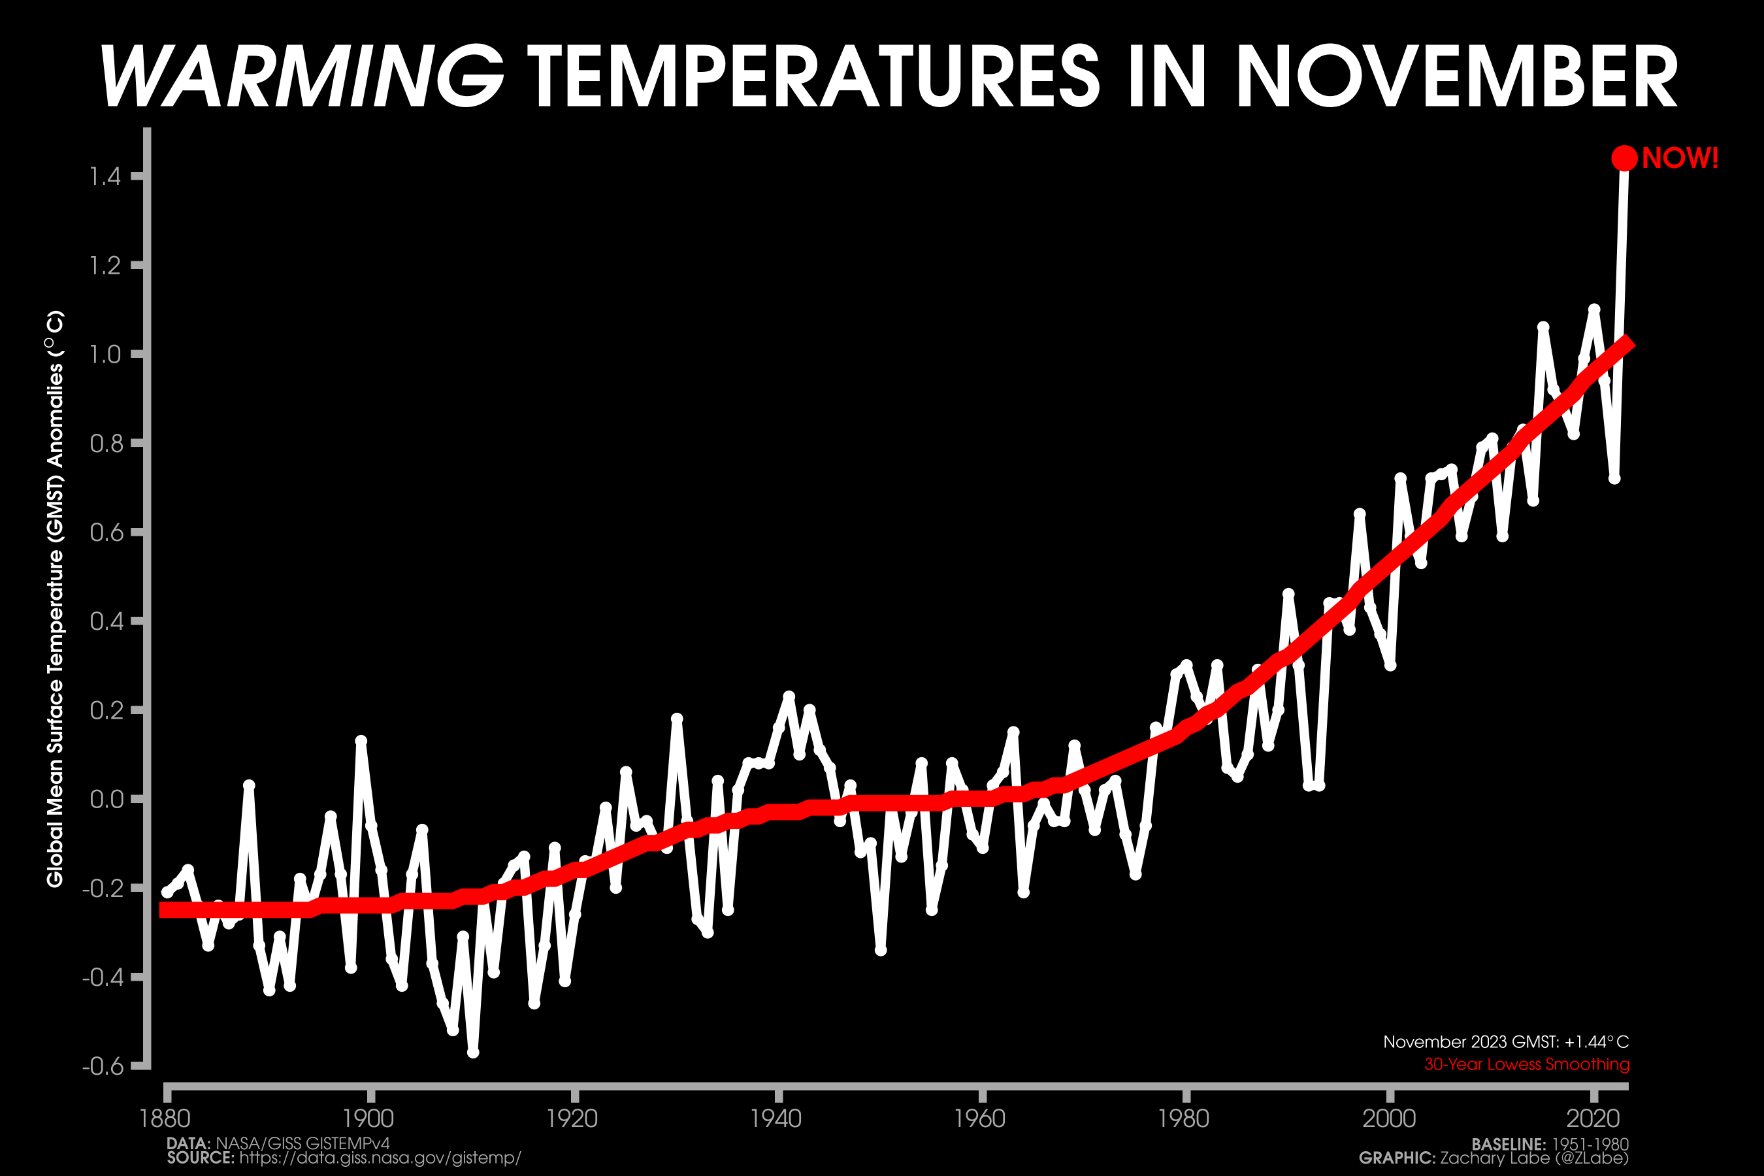
Line graph time series of global mean surface temperature anomalies for every November from 1880 through 2023. A red 30-year lowess smoothing line is also shown. Anomalies are computed relative to a 1951-1980 baseline. The global mean surface temperature anomaly in November 2023 was +1.44°C. There is large interannual variability and a recent long-term warming trend.

Download link

https://fediscience.org/system/media_attachments/files/111/579/631/988/572/505/original/10f71646c23e6756.png

Notices where this attachment appears

  1. Zack Labe (zlabe@fediscience.org)'s status on Thursday, 14-Dec-2023 16:49:12 UTC Zack Labe Zack Labe

    Is anyone actually surprised by this? Another new global temperature record for November 2023...

    (Preliminary) NASA GISTEMPv4 data/info: https://data.giss.nasa.gov/gistemp/faq/

    In conversation Thursday, 14-Dec-2023 16:49:12 UTC from fediscience.org permalink
  • Help
  • About
  • FAQ
  • Privacy
  • Source
  • Version
  • Contact

Bobinas P4G is a social network. It runs on GNU social, version 2.0.1-beta0, available under the GNU Affero General Public License.

Creative Commons Attribution 3.0 All Bobinas P4G content and data are available under the Creative Commons Attribution 3.0 license.