Bobinas P4G
  • Login
  • Public

    • Public
    • Groups
    • Popular
    • People

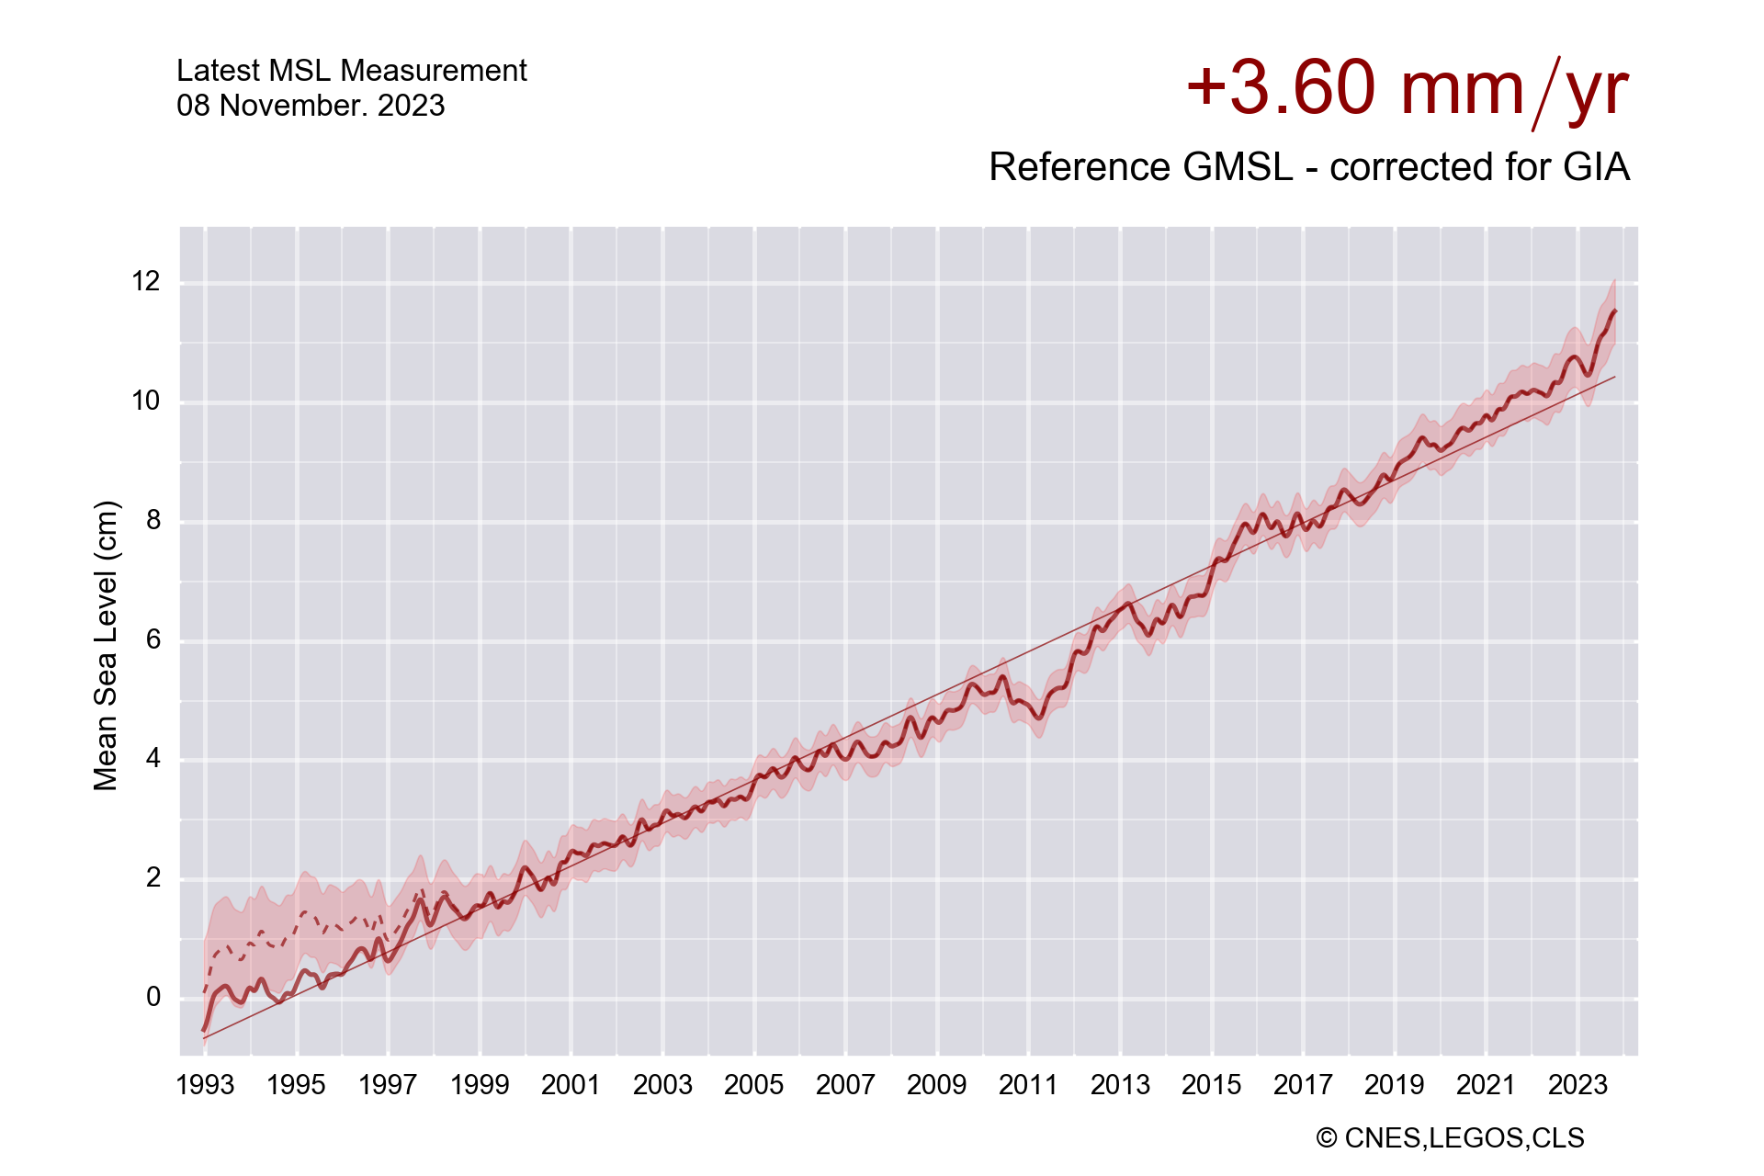
Line graph time series showing the latest mean sea level as of 8 November 2023 using data from 1993. There is a long-term increasing trend and linear trend line shown on the graph. The current rate of increase is +3.60 mm/yr.

Download link

https://fediscience.org/system/media_attachments/files/111/621/441/853/578/613/original/cd79a1fd963ad3c1.png

Notices where this attachment appears

  1. Zack Labe (zlabe@fediscience.org)'s status on Friday, 22-Dec-2023 01:44:32 UTC Zack Labe Zack Labe

    Another global sea level update with satellite altimetry data now processed through early November 2023 🌊

    + Note that this graph was produced by https://aviso.altimetry.fr/en/data/products/ocean-indicators-products/mean-sea-level.html

    In conversation Friday, 22-Dec-2023 01:44:32 UTC from fediscience.org permalink
  • Help
  • About
  • FAQ
  • Privacy
  • Source
  • Version
  • Contact

Bobinas P4G is a social network. It runs on GNU social, version 2.0.1-beta0, available under the GNU Affero General Public License.

Creative Commons Attribution 3.0 All Bobinas P4G content and data are available under the Creative Commons Attribution 3.0 license.