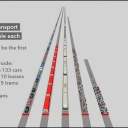
This video shows how 200 people cross the line of a signal head in different modes. There are 133 cars to take account for the typical occupation of cars, 10 busses, since there are typically (arguably) 20 passengers in a bus in an urban setting, 5 trams assuming an average of 40 passengers, and of course 200 cyclists and 200 pedestrians. All lanes are 3.5 m wide.
SPACE
At the moment when the signal turns green the 133 cars require 1030 m to align in front of the signal. This makes up for a person (!) line density of 0.19 persons per meter or an area density of 0.055 persons / square meter (18 sqm per person). The busses go with a fraction of this: 134 m, which means 1.49 persons / meter or 0.43 persons / square meter (2.3 sqm per person). For the trams this is very similar: 197 m (1.01 persons / meter or 0.29 persons / square meter, resp. 3.4 sqm / person). For the cyclists 115 m are required (1.74 persons / meter or 0.50 persons / square meter). As expected pedestrians require the fewest space: they spread over 27.6 m (7.2 persons / meter or 2.07 persons / square meter).
TIME
The two public transport variants pass the signal line first after 31 s (busses) and 32 s (trams). They are soon followed by pedestrians (38 s). It takes 109 s for the last cyclist to cross the line and s before the last car does so.
FLOW
From the times flows can be calculated. This could be vehicle flow as well as person flow, where for cyclists and pedestrians this means the same. For convenience the results are given per hour as well as per second and per 3.5 m lane as well as per meter cross section width. Busses achieve the highest person flow rate with 23226 passengers per hour per lane (6.45/s/lane, 6635/h/m, 1.84/s/m) with the flow of busses being 1161/h/lane (0.32/s/lane) immediately followed by trams with 22500 passengers per hour per lane (6.25/s/lane, 6429/h/m, 1.79/s/m) with the flow of trams being 563/h/lane (0.16/s/lane). Pedestrians achieve a flow rate of 18947 pedestrians per hour and lane (5.26/s/lane, 5413/h/m, 1.50/s/m). Cyclists have an average flow rate of 6050 cyclists per hour and lane (1.68/s/lane, 1728/h/m, 0.48/s/m). However, this is just the average. Since cyclists can overtake they partially sort by their desired speed. With slow cyclists at the end of the field also the flow is reduced during the final about 20 seconds. Capacity flow of cyclists before that is about 2050/h/m which matches well with certain empirically observed data (see for example Seriani, et al. “Experimental study for estimating capacity of cycle lanes “) although the range of values that can be found in literature spreads over a very wide range indicating the need for more research. Finally the flow of people in cars is by far the smallest one: 2903 persons per hour and lane (0.81/s/lane, 829/h/m, 0.23/s/m) with a flow of cars of 1931/h/lane (0.54/s/lane).
SPEEDS
From the queue length and the time it takes the last person to pass the signal one can calculate an average speed of the last person. Since the actual speed changes a lot during that time this value is of less interest than the values given before, but for completeness they are given: trams: 22.2 km/h (6.2 m/s), busses: 15.6 km/h (4.3 m/s), cars: 15.0 km/h (4.2 m/s), cyclists: 3.5 km/h (1.0 m/s), pedestrians: 2.6 km/h (0.7 m/s).
DESIRED SPEEDS (and other settings)
These results have been obtained by means of simulation and they depend on the simulation settings. Among the most important settings are desired speeds. For all modes distributions of desired speeds have been used, i.e. all cars, cyclists, etc. had their own individual speed different from the speed of other cars, cyclists, etc.. In the following the mean and in brackets min and max values are given in km/h: cars, busses, and trams: 53 (48, 58), cyclists: about 23 (14, 35), pedestrians 6 (5.5, 6.5). For motorists this is the Vissim default speed distribution “50 km/h” and for cyclists it is the distribution called “KK_normal_cyklist” from the City of Copenhagen and COWI “Micro Simulation of Cyclists in Peak Hour Traffic” guideline.
For the driving behavior Vissim’s default “Urban (motorized)” has been used for the motorist links. For cyclists it is “Krydsstraekning” from said guideline (with two minor modifications). Pedestrians’ walking behavior has parameters which are different from defaults to receive a more moderate standstill density compared to commuters, festival visitors or emergency evacuees, but still have a good flow rate.
ACKNOWLEDGEMENTS
This work has partly been done in the framework of and was inspired by the FLOW project. http://h2020-flow.eu/
SEE ALSO:
How does this look in Paris? https://youtu.be/0dyk6Kp6eUM
There is also a raw version of this video (without in video comments and fast forward): https://youtu.be/IpaNLxrtHOs
How wide do the roads have to be so all times are equal? https://youtu.be/g_ILtWzH3Ko
Vissim: https://www.ptvgroup.com/en/solutions/products/ptv-vissim/
.
 rtfm
rtfm
