Bobinas P4G
  • Login
  • Public

    • Public
    • Groups
    • Popular
    • People

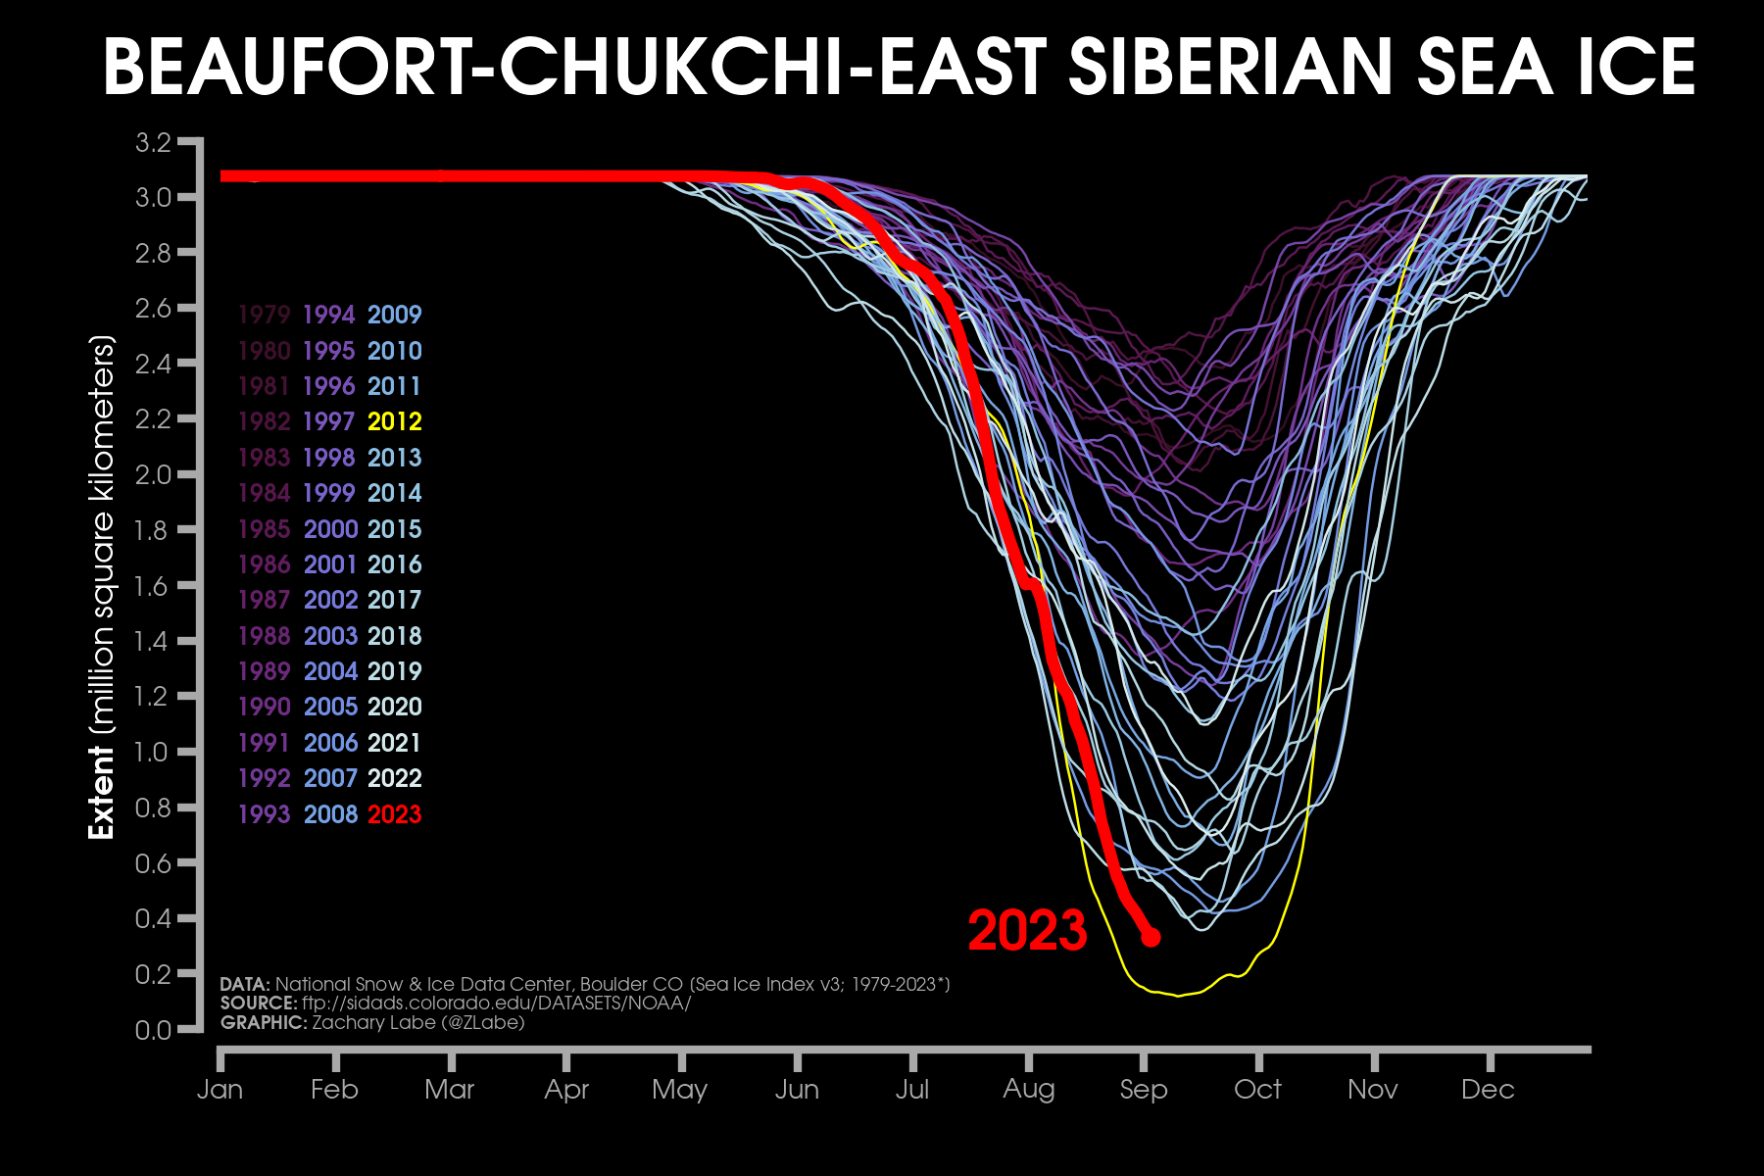
Line graph time series of 2023's daily Arctic sea ice extent compared to each year from 1979 to 2022 as shown with thin lines in colors from purple to white. This graph is for the Beaufort, Chukchi, and East Siberian Seas regions. There is large daily variability, but a long-term decreasing trend is visible during the melt season months. A seasonal cycle is also visible in this region, with the basin filling up completely with ice during the wintertime for all years. The lowest on record is 2012.

Download link

https://fediscience.org/system/media_attachments/files/111/007/021/413/535/342/original/f31170a99f06a8f4.png

Notices where this attachment appears

  1. Zack Labe (zlabe@fediscience.org)'s status on Monday, 04-Sep-2023 14:38:55 UTC Zack Labe Zack Labe

    Sea ice across the Pacific side of the #Arctic has now dropped to the 2nd lowest on record in at least the satellite-era. This is a lot of open water.

    Compare 2023 compare with the purple lines (1980s)...

    Map of Arctic: https://zacklabe.files.wordpress.com/2022/08/b203f-nsidc_mapseas.png. Data: https://nsidc.org/data/seaice_index.

    In conversation Monday, 04-Sep-2023 14:38:55 UTC from fediscience.org permalink
  • Help
  • About
  • FAQ
  • Privacy
  • Source
  • Version
  • Contact

Bobinas P4G is a social network. It runs on GNU social, version 2.0.1-beta0, available under the GNU Affero General Public License.

Creative Commons Attribution 3.0 All Bobinas P4G content and data are available under the Creative Commons Attribution 3.0 license.